How often does the winning team score more baskets in NBA games?
Dec 23, 2021
r
basketball
Okay, the title sounds kind of stupid at first glance, but hear me out…
Recently, I tried to explain the rules of basketball to a friend. While attempting to boil down the game of basketball to its bare bones, I resorted to “just count how many times the ball goes through the hoop.” Forget about whether it’s a free throw, 2-pt field goal, or a three, just count how many times the ball goes through the hoop for each team. It sounds intuitive, but I don’t actually know how well this strategy works out in real life.
This led me to a simple question: how often would counting how often the ball goes through the hoop for each team correctly tell you which team actually won?
Data
I found a dataset of NBA game data with player stats on Kaggle. It goes from 2004 season through December 2020. I’m going to use only full seasons, so 2004-2019.
Analysis
Importing datasets with only necessary columns. The games dataset is only for joining season information to game_details.
require(tidyverse)

games <- readr::read_csv("games.csv",
                         col_select = c("GAME_DATE_EST",
                                        "GAME_ID",
                                        "SEASON"))

game_details <- readr::read_csv("games_details.csv",
                                col_select = c("GAME_ID",
                                               "TEAM_ABBREVIATION",
                                               "PLAYER_ID",
                                               "FGM",
                                               "FG3M",
                                               "FTM",
                                               "PTS"))

game_details <- game_details %>% dplyr::left_join(games, by = "GAME_ID")
I’m only interested in full season, so I filter down to only full seasons in the dataset (2004-2019).
game_details <- game_details %>% dplyr::filter(SEASON >= 2004 & SEASON <= 2019)I want to compare PTS (points) to B (buckets) for each game. B (buckets) is a field I’m creating that adds up FGM (field goals made) and FTM (free throws made). Note that FG3M (3-point field goals made) is a subset of FGM, which is why it’s not included in B.
game_sum <- game_details %>%
  dplyr::group_by(GAME_ID, TEAM_ABBREVIATION) %>%
  dplyr::summarise(PTS = sum(PTS),
                   B = sum(FGM,FTM))
To answer the question, I have to compare points and buckets between the two teams for each game.
If for a given game, the winning team scores more buckets, my basic basket counting method worked! Otherwise, it didn’t. sadface
# RESULT: Result of game in points, WIN or LOSE
game_sum <- game_sum %>%
  dplyr::arrange(GAME_ID, desc(PTS)) %>%
  dplyr::mutate(RESULT = ifelse(row_number() == 1, "WIN","LOSE"))

# MORE_B: Scored more buckets, YES or NO
game_sum <- game_sum %>%
  dplyr::arrange(GAME_ID, desc(B)) %>%
  dplyr::mutate(MORE_B = ifelse(row_number() == 1, "YES","NO"))

# How often did the winning team score more buckets?
answer <- game_sum %>%
  dplyr::filter(RESULT == "WIN") %>%
  dplyr::group_by(MORE_B) %>%
  dplyr::summarise(GAME_COUNT = n()) %>%
  dplyr::mutate(PCT = round(GAME_COUNT / sum(GAME_COUNT), 3))
Result
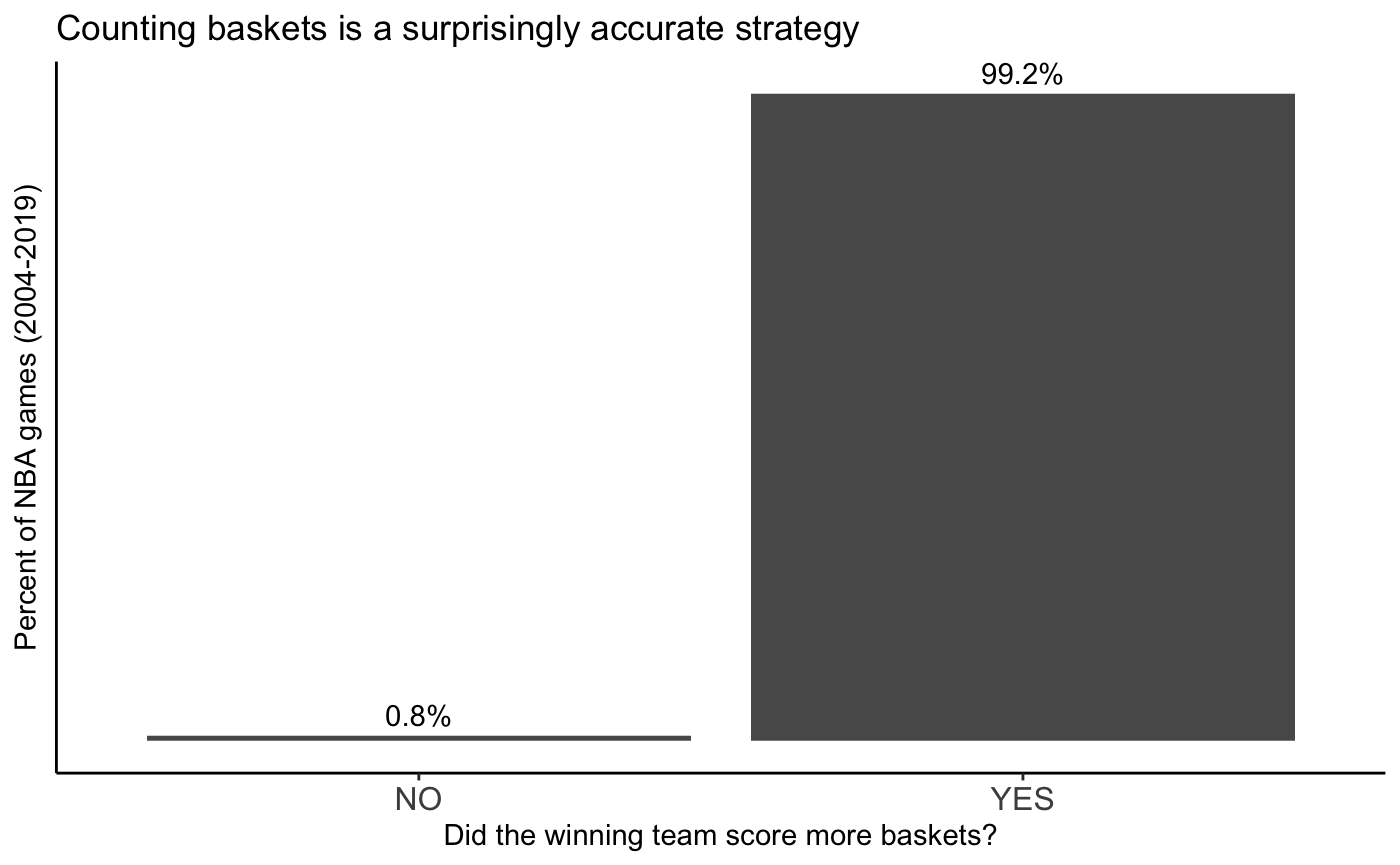
How often does the winning team score more baskets, regardless of whether the baskets count for 1pt, 2pt, or 3pts?
Nearly all of the time.
ggplot(answer, aes(x=MORE_B, y=PCT)) +
  geom_bar(stat="identity") +
  geom_text(aes(label = sprintf("%1.1f%%", 100*PCT)), vjust = -0.5) +
  labs(title = "Counting baskets is a surprisingly accurate strategy",
       x = "Did the winning team score more baskets?",
       y = "Percent of NBA games (2004-2019)") +
  theme_classic() +
  theme(axis.text=element_text(size=12),
        axis.text.y=element_blank(),
        axis.ticks.y=element_blank())